Infographics
The infographic style is bold and clean, where colours are used to make the data stand out. To ensure consistency in the use of colour, the selected tones should be used in charts following the present order.
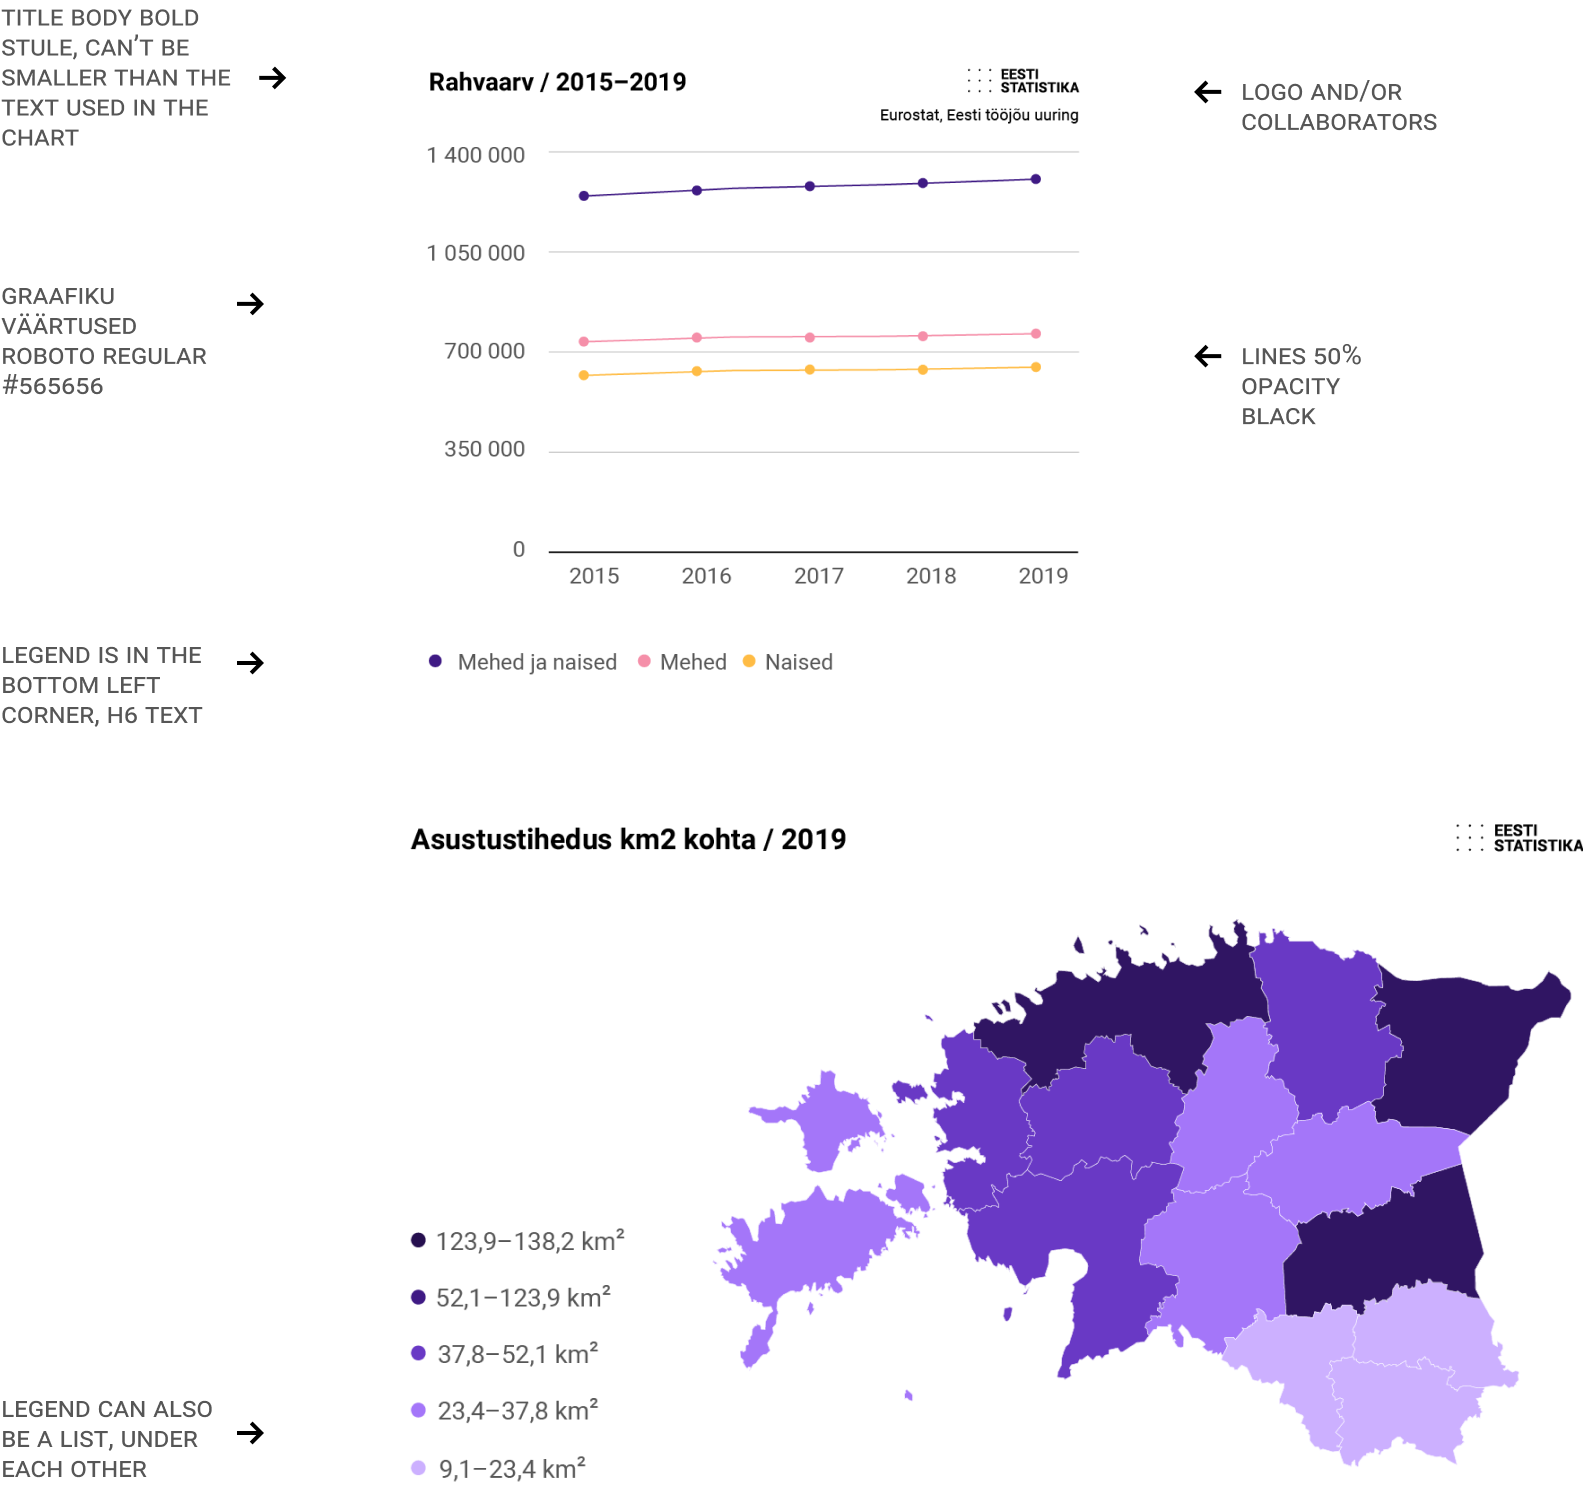
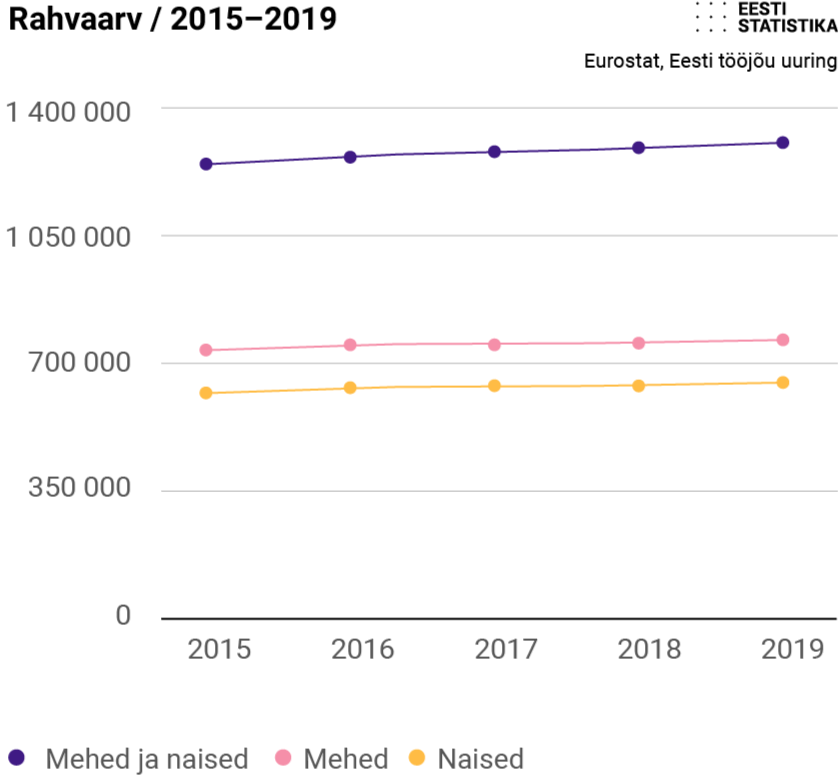
01. Line chart
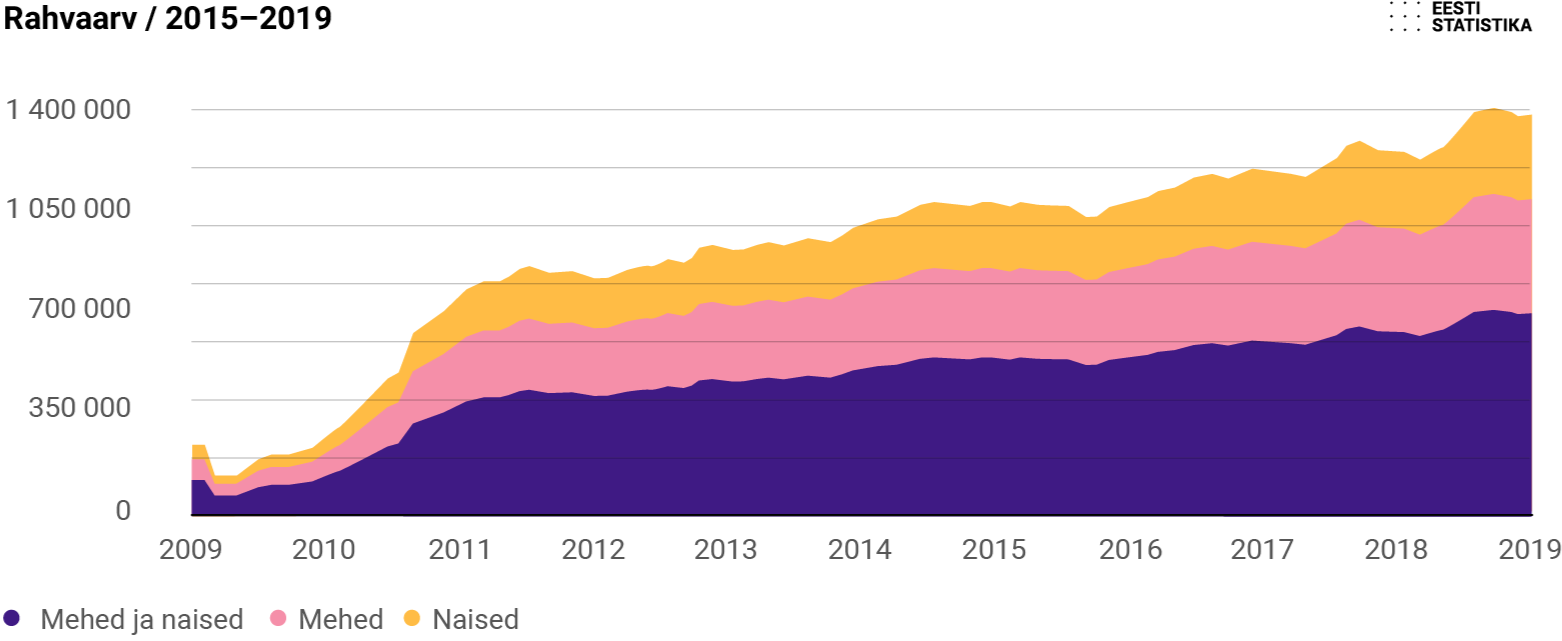
02. Area chart
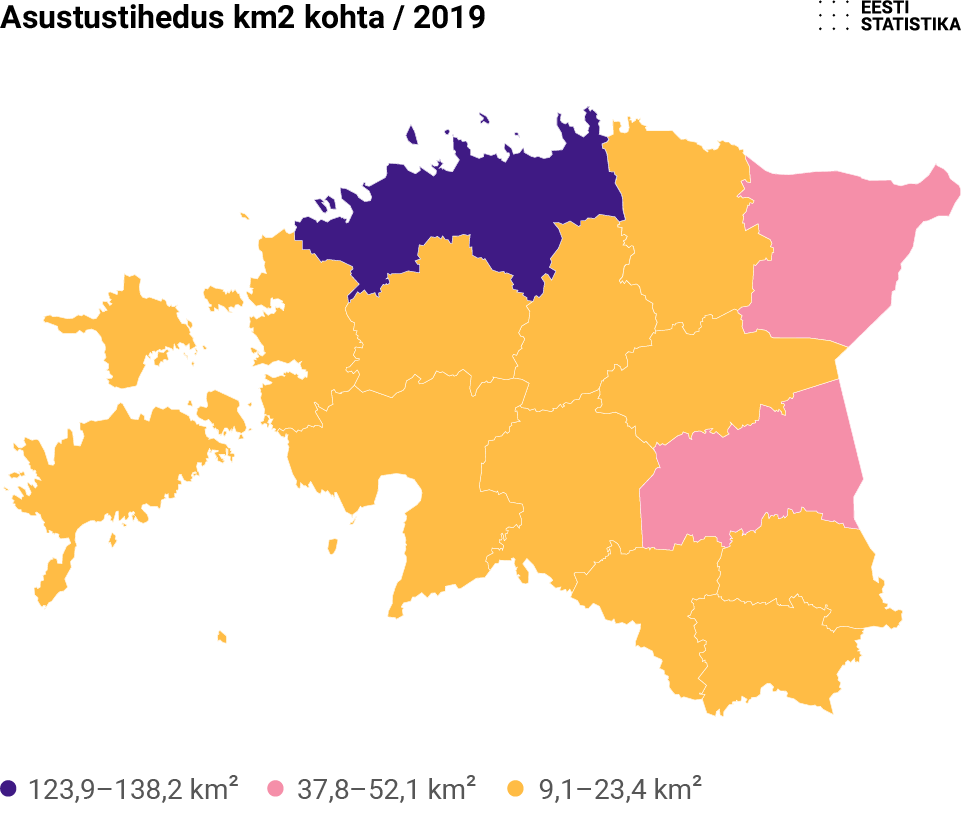
03. Map
A white border separates the different counties and areas.
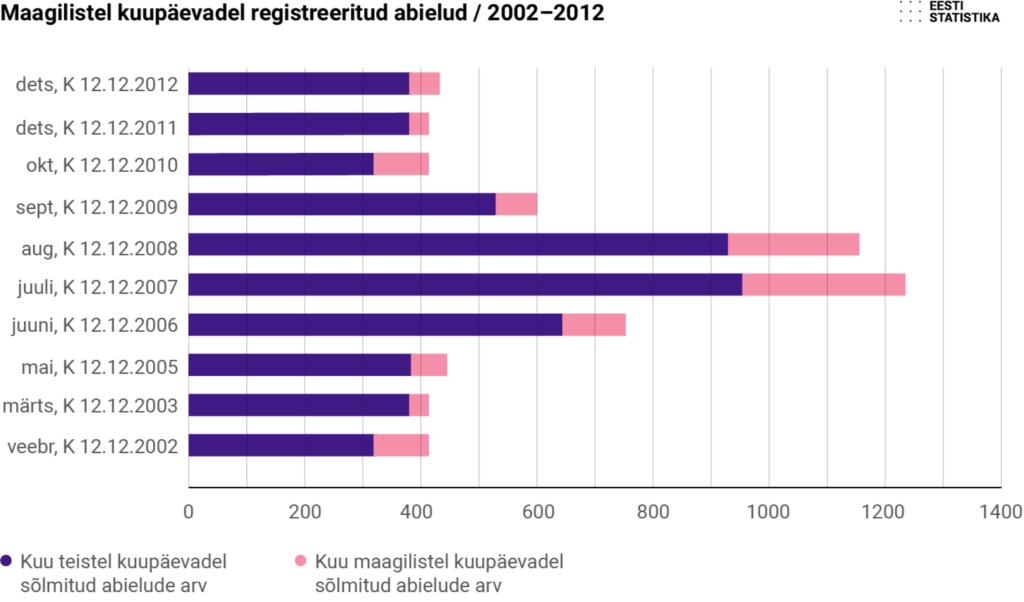
04. Bar chart
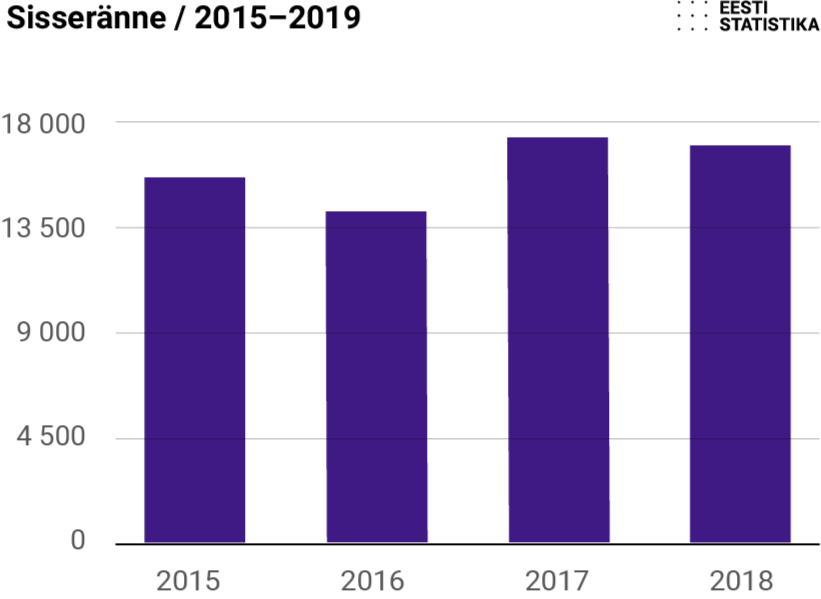
05. Vertical bar chart
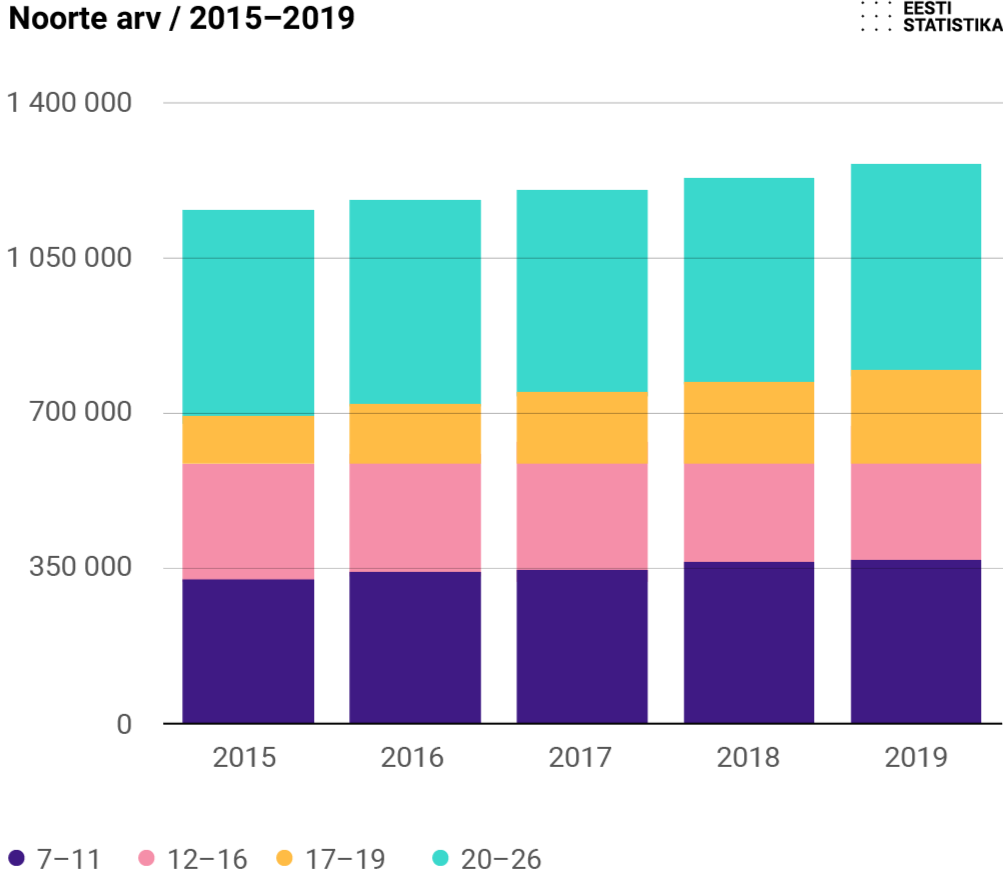
06. Stacked bar chart
07. Treemap

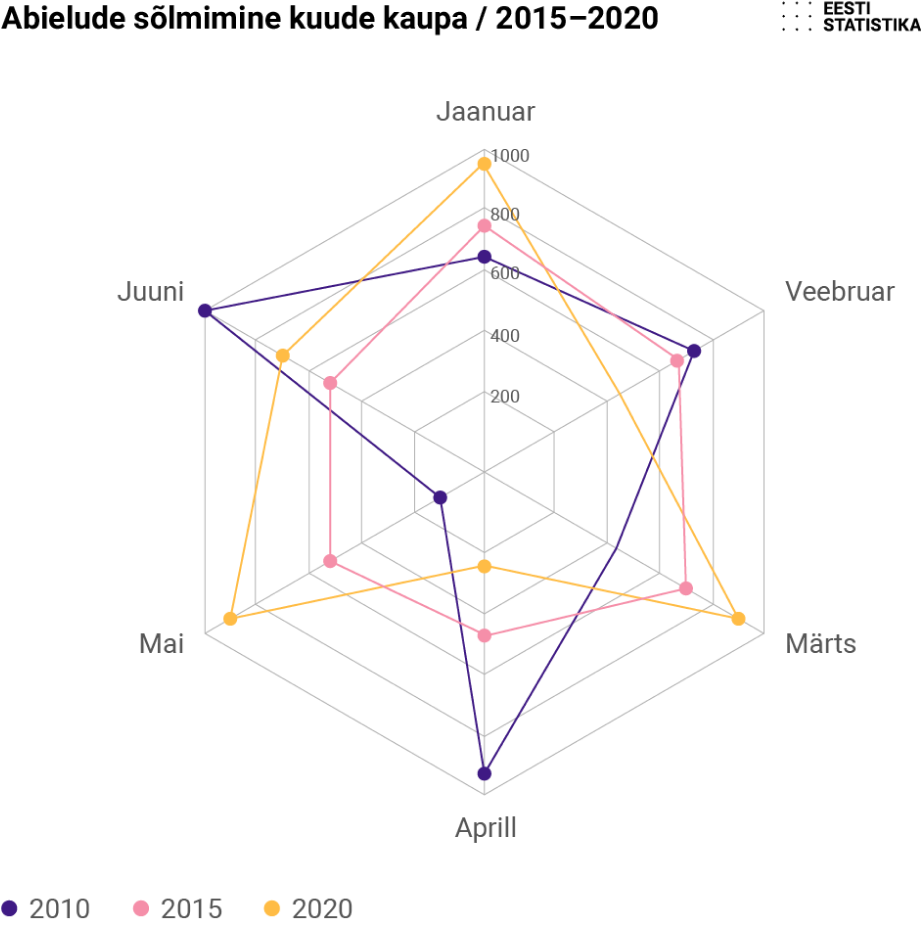
08. Radar chart
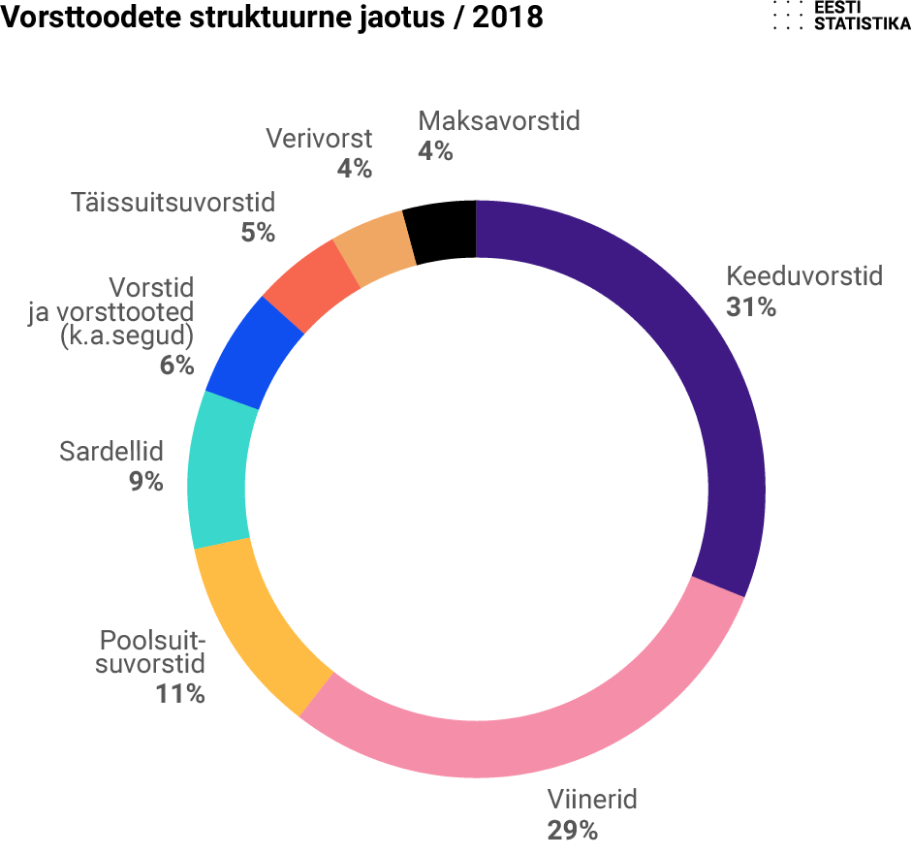
09. Pie chart
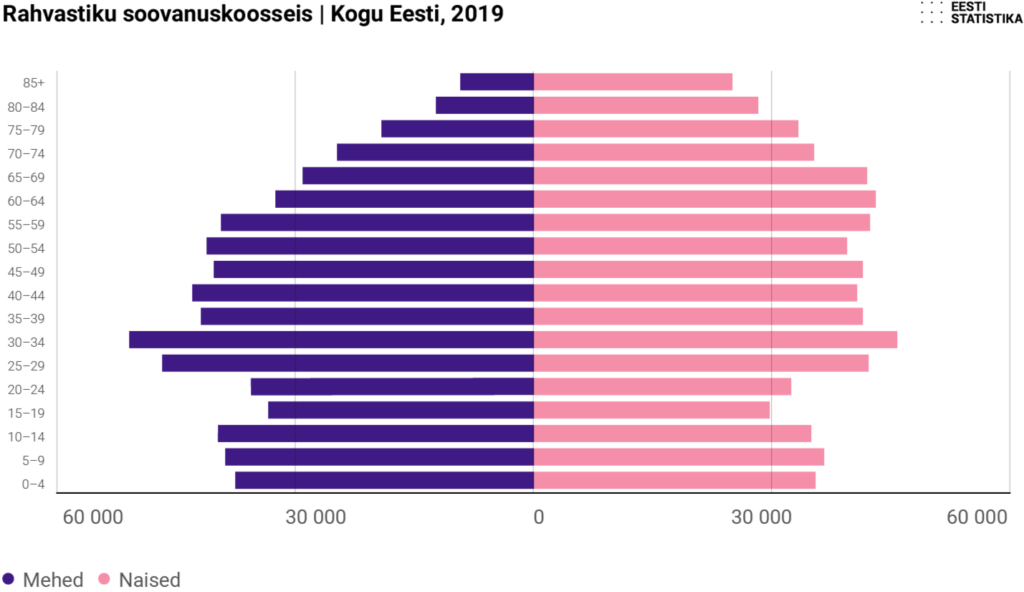
10. Population pyramid